Pictured: Alan Coleman, Wolfgang Digital
Wolfgang Digital has analysed over 48 million website sessions and over €172 million euro in online revenue over the past 11 weeks (Monday-Sunday), to compile a weekly report covering the previous week’s movements in the online economy during the Covid-19 crisis.
The first four weeks fell in February and, as such, were recorded before the Covid-19 crisis took hold. The next 7 weeks are from March into April when the crisis started to escalate. When Wolfgang Digital say ‘last week’, they are referring to Monday 13th – Sunday 19th April. Here are last week’s figures.
Retail
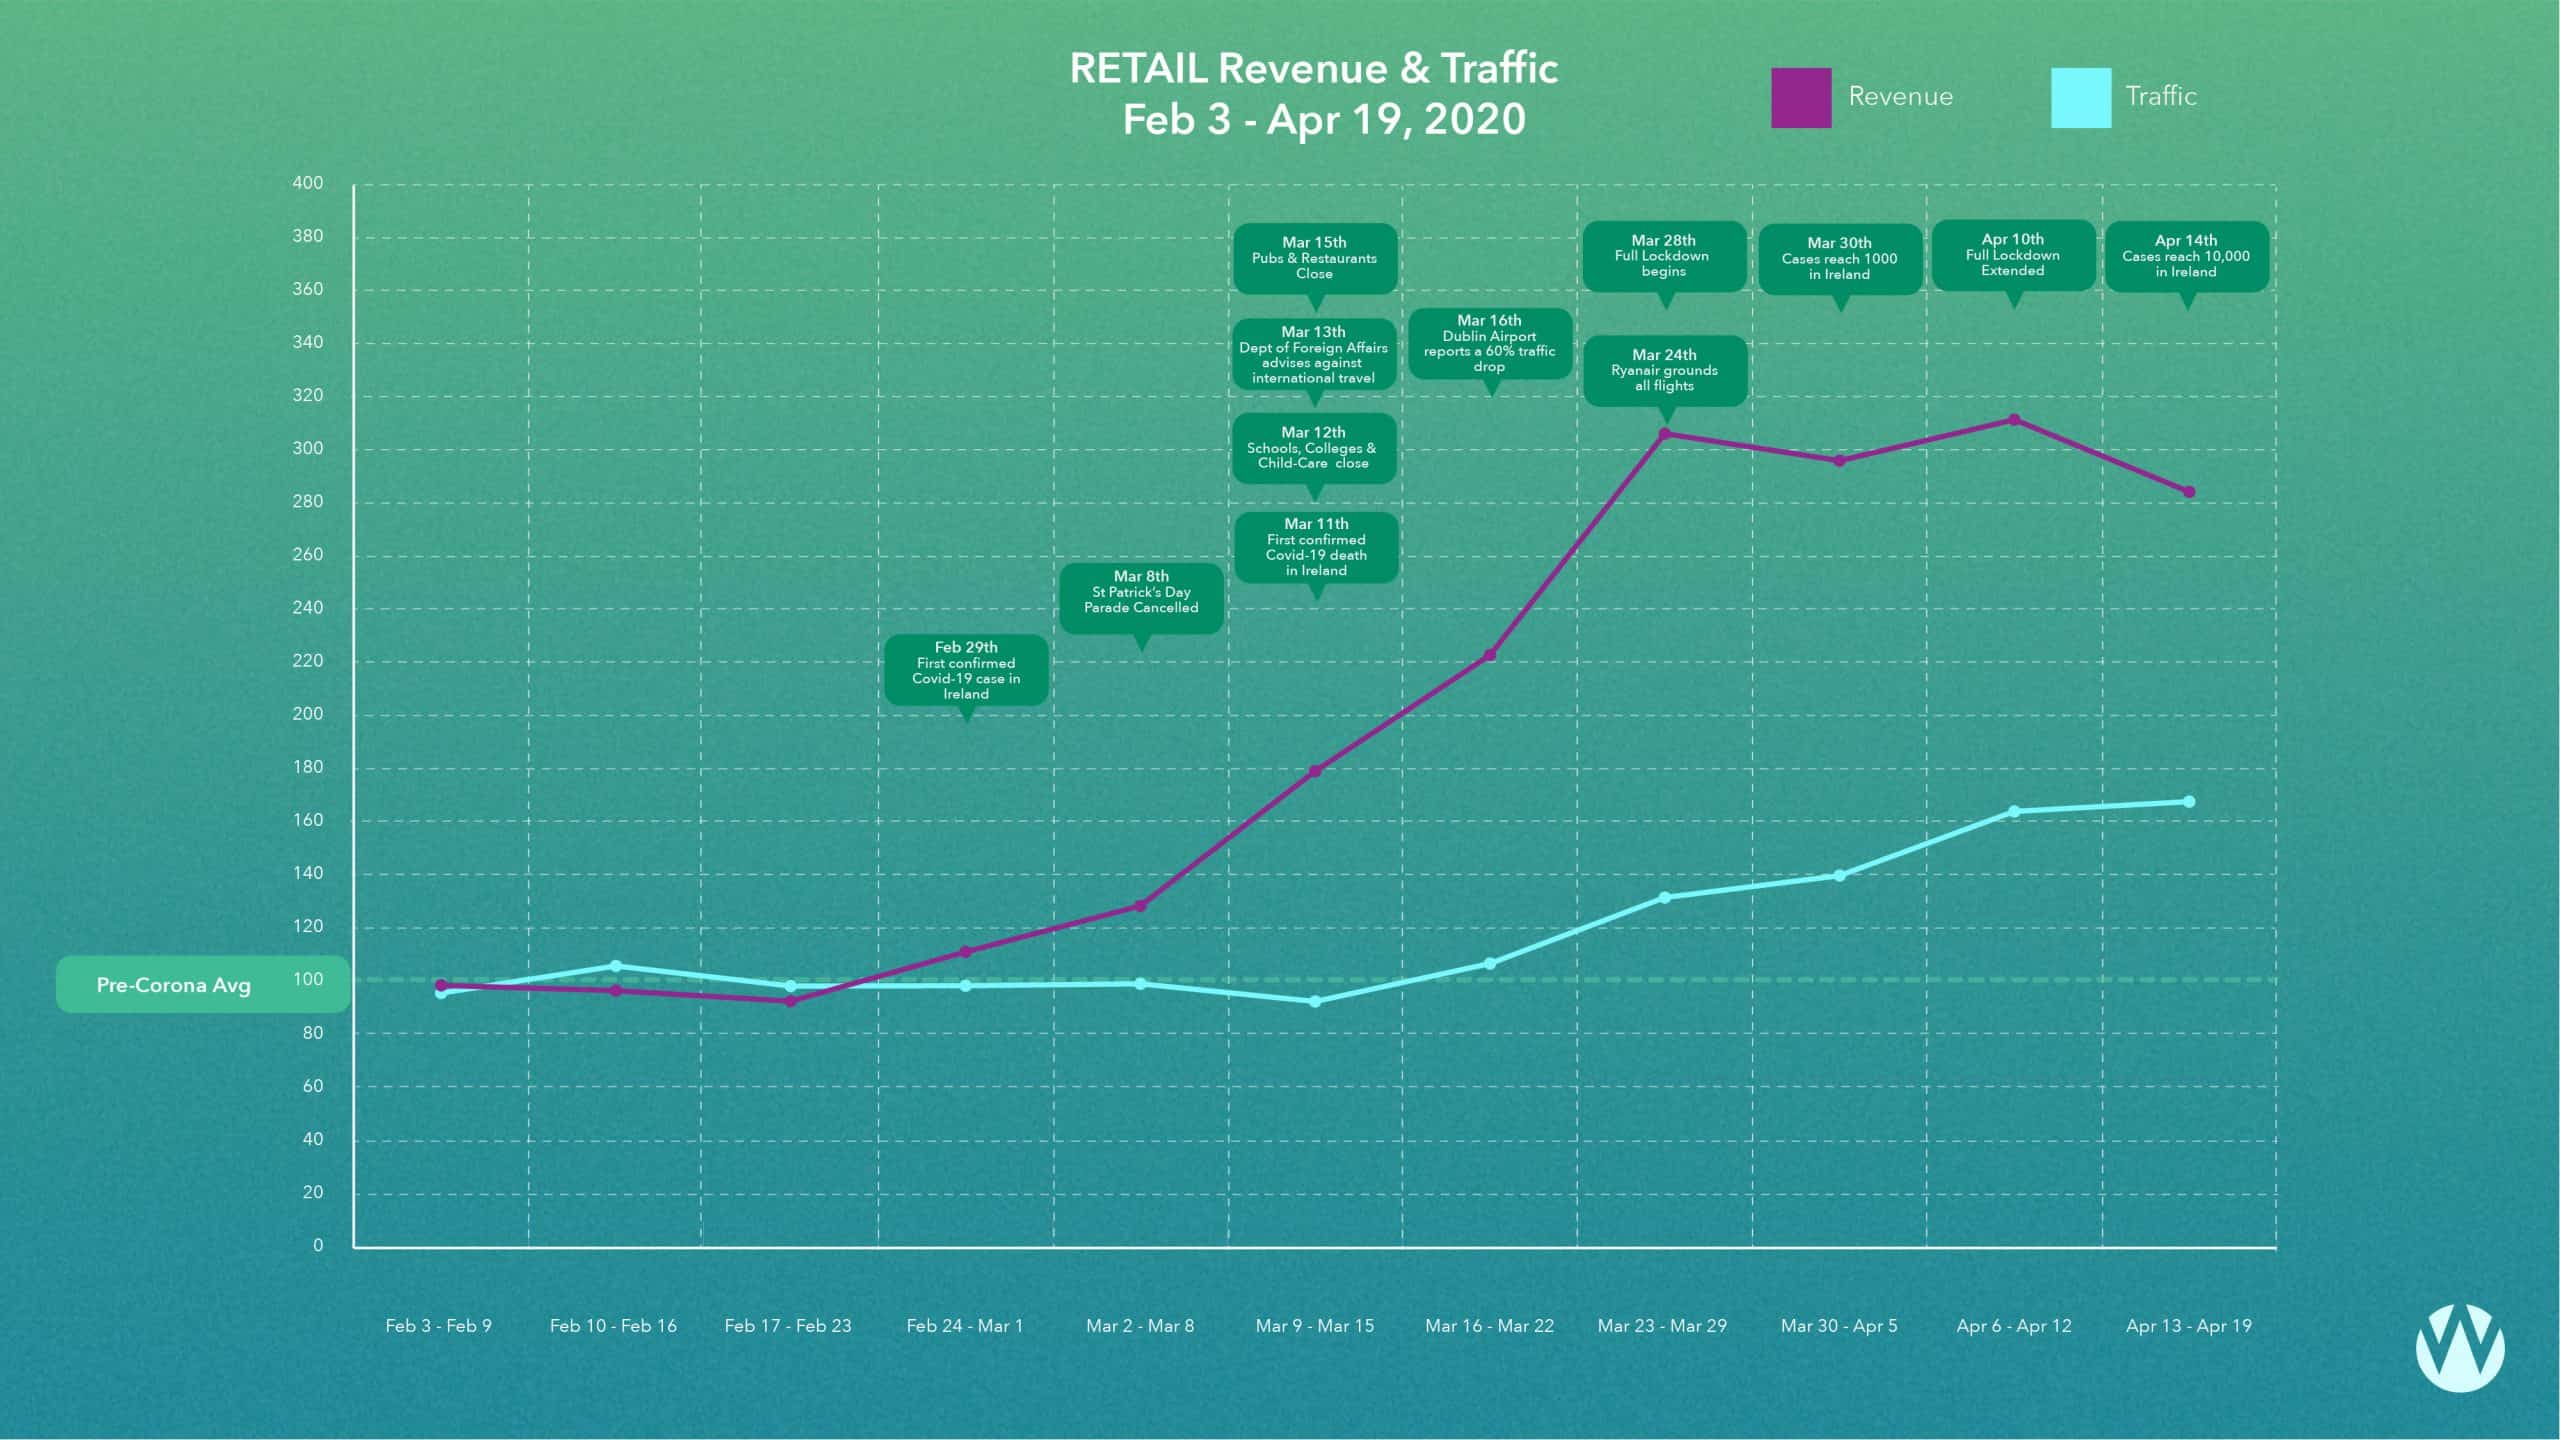
The third week in April saw a 68% increase in traffic on pre-Covid levels for online retailers. This is trending upwards and the high-point in traffic levels. For many retailers it was among their busiest weeks for online traffic.
The peak in traffic suggests that online research behavior is at an all time high. Online revenues were up 185% . This is trending downwards by 9% on last week’s high. Spends tend to trend downwards as the month progresses, and then increase in the last week when consumers get paid. You can follow these peaks and declines in revenue through the month in Wolfgang Digital’s retail graph.

The peak in traffic signals that when wages are paid next week, we may see a new peak set in online revenue.
Corona Crisis’ impact on advertising costs
Advertising is traditionally among the first overheads on the chopping block in a recession. This has always been the case. However, this is the first recession since performance marketing revolutionised the ad industry. Advertising’s characteristics have changed since the financial crisis of 2008. There are 2 interesting questions a business can ask themselves to make more informed decisions around ad spend:
1. Is there a price reduction already in place as a result of real time bidding?
2. Is advertising still to be seen as an overhead to be cut, or a cost of sales to be invested in?
Price reductions
Everybody is seeking to cut costs. With real time bidding, price changes happen automatically for online advertisers.
Google and Facebook’s advertising model is real time auctions. That means the price of a click isn’t determined by the media owner every month or even every week. The cost of a click is calculated every single time an ad impression occurs based on the advertisers in the auction, bidding for that ad click at that time.
Google and Facebook ads CPC’s are as liquid and as dynamic as the stock market, with billions of ads being served every day. So if advertisers are leaving the market, then cost per clicks will decline, in real time. Just as the Covid-19 crisis has precipitated a sell off on the global stock markets, we are witnessing a bear market on Google and Facebook CPCs.
“This is the first recession since performance marketing revolutionised the ad industry. Advertising’s characteristics have changed since the financial crisis of 2008.”
Analysing cost per clicks across retailers finds that Google CPCs have decreased 9% from pre-Covid average of 24 cents to post-Covid average of 21 cents. Facebook cost per clicks are down 12% from 8 cents to 7 cents.
This means an advertiser could reduce their Google ad spend by 9% and still expect at least as much traffic. Or maintain spend and benefit from a 10% traffic lift.
These declining cost per clicks, coupled with increasing revenue per clicks make for widening return on investment.
So everybody everywhere is cutting costs
But what type of a cost is online advertising? Is online advertising an overhead to be cut or a cost of sale to be invested in? Businesses traditionally see marketing as an overhead, which should be cut during a downturn to see an immediate benefit to the bottom line.
But what if performance marketing is a cost of sale, and cutting it will see an immediate decline in top line revenue and bottom line profit?
Wolfgang Digital’s data suggests that: “This is the first recession in history, in which marketing can be viewed no longer as an overhead to be cut, but as a cost of sales to be invested in.”
The metric which best illustrates this is Return on Adspend (ROAS). It conveys that for every €1 spent in advertising, you receive €Xs in return. Google’s average return on adspend for retailers has risen from 11:1 to 20:1. Facebook’s average adspend for retailers has risen from 4.8:1 to 7:1.
With profit margins widening on both the cost per click and the revenue per click sides for online retailers, ROAS is increasing. There presents a tremendous opportunity for those retailers who are willing to go against the traditional thinking of cutting ad spend in a downturn.
In the investment community, contrarian thinkers such as Warren Buffet famously buy the bear market knowing they will see an exceptional return on their investment in the years to come.
This is the first recession in which contrarian thinking businesses can buy the bear market for website traffic and see an exceptional return on their investment, this month.
Travel
Last week’s traffic was down 75% on pre-Covid levels. Last week’s online revenue was trending down by 97% of the pre-Covid weekly average.
About the data
There are approximately 100 retail and travel e-commerce merchants of various sizes in the data set. Each contributor is apportioned equal weighting on the final figure regardless of the size of their traffic and revenue. The data set is dynamic. This may lead to slight variances in the figures as time passes.
View the full report on Wolfgang Digital’s website.

